
Pick the wrong one and you'll either ship a feature-heavy library just to render a CRUD table, or spend six months reimplementing Excel because you started with a grid. The two components look almost identical at a glance — rows, columns, headers, scrollbars — but they're built for very different jobs. This article breaks down what each is designed to do, where they overlap, where they diverge, and which one fits the kind of application you're actually building.
What is a grid component?
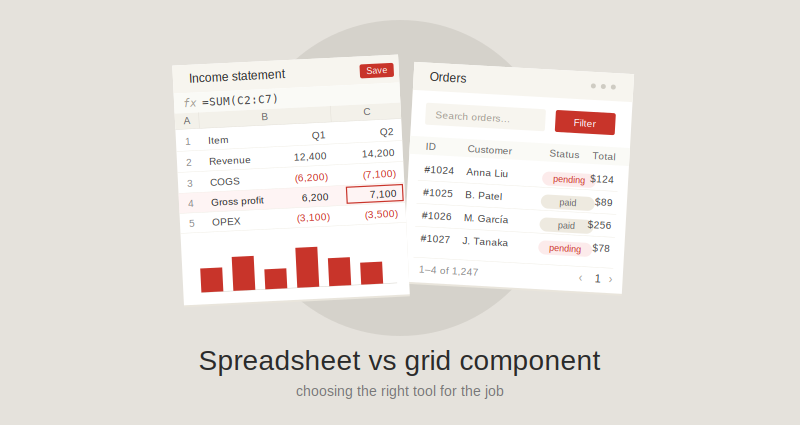
A data grid component (sometimes called a "data table" or just "grid") is a UI library for displaying and editing structured tabular data — typically data that originates from a database, an API, or an in-memory collection. Its primary job is to render rows and columns of records efficiently, let users sort, filter, group, and scroll through them, and optionally edit individual cells.
Popular examples include AG Grid, MUI X DataGrid, TanStack Table, and Handsontable in its grid mode.
The mental model is: developer-controlled data + user interaction with that data.
What is a spreadsheet component?
A spreadsheet component is a UI library that replicates the experience of working in Excel or Google Sheets inside your application. In addition to displaying rows and columns, it provides a formula engine, cell-level formatting, multiple sheets (tabs), charts, named ranges, and high-fidelity import/export of .xlsx files.
Examples include Keikai, SpreadJS, and Univer.
The mental model is: end users do their own computation, modeling, and analysis inside your application, the way they would in Excel.
Where they overlap
This is the part that confuses most early architecture decisions. Modern grids and spreadsheets share a long list of features:
- Frozen rows and columns
- Cell editing
- Cell and range selection (single, multi-range)
- Keyboard navigation (arrow keys, Tab, Enter)
- Custom cell renderers
- Sorting and filtering
- Resizable rows and columns
- Copy/paste from the clipboard
- Virtualization for large datasets
- Theming and styling APIs
If your requirements list contains only items from this category, either kind of component can do the job, and other factors — bundle size, license, performance characteristics — should drive the decision.
Where they diverge
The differences begin where the two components' core purposes diverge.
| Capability | Grid component | Spreadsheet component |
|---|---|---|
| Formula engine | None, or very limited | Full (often 300+ Excel-compatible functions) |
| Cell references (A1, B2) | No | Yes |
| Multiple sheets / tabs | No | Yes |
| Cell-level formatting (fonts, colors, borders) | Limited, usually per-column or via renderers | Per-cell, like Excel |
| Number formats | Basic | Full Excel-compatible formats |
| Charts driven by cell ranges | No (charts come from data, not the grid) | Yes |
| Pivot tables | No | Often yes |
| Conditional formatting | Limited or DIY | Built-in |
| Data validation rules | DIY | Built-in |
| Named ranges | No | Yes |
.xlsx import / export |
Sometimes export only | Both, usually high fidelity |
| Cell dependency tracking | No | Yes (recalculation on change) |
| Typical bundle size | Smaller | Larger |
| Optimized for | Large datasets, fast rendering | Complex calculations, user authoring |
Two of these differences carry most of the architectural weight: the formula engine and high-fidelity Excel I/O. Everything else can be approximated; these two are very expensive to build from scratch.
Performance characteristics
Grids and spreadsheets have different jobs, so they have different performance concerns. Comparing them head-to-head on the same workload usually isn't meaningful — pick the right tool for the workload first, then evaluate that tool on the things it's actually doing.
For a grid handling large datasets, the things to look at are virtualization (rendering only the rows and columns currently in view) and how the grid loads data lazily — paginated fetching, infinite scroll, server-side row models. These features are what determine whether the component stays responsive at 50,000 rows, 500,000, or beyond. A grid without them will struggle long before the dataset gets interesting.
For a spreadsheet, the bottleneck is almost always the formula dependency graph. When cells refer to other cells, which refer to other cells, a single edit can cascade through the whole workbook. Workbooks with deeply interconnected formulas — long dependency chains, wide fan-outs, volatile functions like NOW() or OFFSET() — can stall recalculation even when the total cell count looks modest. What to look at here is how the engine handles incremental recalculation, whether it isolates dirty regions of the graph rather than recomputing everything, and how it behaves on the kinds of formulas your users actually write.
Note that "large data" is not, on its own, a reason to choose a grid over a spreadsheet. A spreadsheet component handling a million mostly read-only cells with no formulas can be perfectly fine; a grid handling 200 rows with custom renderers that each fire async requests can be miserable. The workload is what matters, not the row count.
Workflow differences: who is the data for?
A quick test that usually clarifies the choice:
Ask who decides what the cells mean.
- If the developer decides the columns, the data model, and what each cell shows, and the user simply views, filters, or edits values within that model — that's a grid workflow.
- If the user decides what goes in the cells, writes their own formulas, restructures their own layout, and treats the component as a tool for thinking — that's a spreadsheet workflow.
Put another way: grids are screens in an application; spreadsheets are mini-applications that live inside an application.
When to choose a grid component
Reach for a grid when the data model is fixed and the user is consuming or maintaining records inside that model. Concrete cases:
- Admin panels and back-office tools — user management, role assignment, audit logs, system configuration tables.
- E-commerce operations — order lists, product catalogs, inventory dashboards, return queues.
- CRM and customer support — contact lists, ticket queues, deal pipelines, activity logs.
- Analytics and observability dashboards — log viewers, metric tables, error tracking lists, application performance breakdowns.
- Trading and market data displays — streaming price tables where rows update many times per second but the schema is fixed.
- Project and task management — lists of tickets, sprints, or assignments where each row is a record in a backend system.
If you find yourself describing the screen as "a list of [things from our database]," you almost certainly want a grid.
Grids are also the right choice when you only need a small slice of spreadsheet-like behavior. If your requirement is "users should be able to enter =A2*1.1 in one column to mark up prices," that's cheap to implement on top of a grid — you don't need a full formula engine, and shipping one would be massively over-built.
When to choose a spreadsheet component
Reach for a spreadsheet when the user needs to compute, model, or author content — when the cells are the point, not just a view onto data the developer assembled. Concrete cases:
- Financial modeling and planning — budgeting tools, forecasting apps, FP&A platforms, cap table management, scenario analysis. These workflows depend on chains of formulas the user writes themselves.
- Accounting and bookkeeping interfaces — anywhere users adjust ledgers, reconcile transactions, or build statements with custom calculations.
- Insurance, actuarial, and tax tools — workflows that historically lived in Excel templates and need to move into web applications without losing user agency.
- Lab notebooks, research data analysis, and engineering calculation sheets — any field where users iterate on formulas as part of their thinking.
- Self-service reporting tools — where end users build the report themselves, pivot the data, and explore it.
- Excel replacement inside enterprise applications — when a company wants to retire shared
.xlsxfiles and put the same workflow into a governed web app, the spreadsheet component is what makes the migration possible. Users can still write formulas, import their existing files, and export results. - Education products that teach spreadsheet skills — the component is the lesson.
A useful heuristic: if your users currently do this work in Excel and you're trying to move them off it, you almost certainly need a spreadsheet component. Anything less and they will fight your product because it took away the tool they relied on.
How to decide: a short checklist
Walk through these questions in order. The first "yes" is usually your answer.
- Do users need to write their own formulas? → Spreadsheet.
- Do users need to import or export
.xlsxfiles with high fidelity? → Spreadsheet. - Do users need multiple sheets or tabs they manage themselves? → Spreadsheet.
- Are you replacing an existing Excel-based workflow? → Spreadsheet.
- Is the data structure fixed by the developer, with users only viewing or editing values? → Grid.
- Are you rendering 100,000+ rows of streaming or paginated data? → Grid.
- Are you building an admin panel, CRUD list, or operational dashboard? → Grid.
When several answers land on different sides, you may genuinely have a hybrid case. In practice, hybrid cases are usually resolved either by picking the spreadsheet (since it can do most of what a grid does, just with a larger footprint) or by using both components in different parts of the application.
The bottom line
Grids and spreadsheets occupy the same visual territory but solve different problems. A grid is the right tool when the developer owns the schema and the user is operating on records. A spreadsheet is the right tool when the user owns the cells and the application is a place for them to compute, model, or author.
If your application is going to compete with Excel, you need a spreadsheet component. If it's competing with a database admin tool, you need a grid. Picking the right one early is a lot cheaper than retrofitting it later.